A few months ago, I found myself needing to know about the reliability of some internal DNS provider’s servers, after getting a series of hardly trackable random network issues, aka “It’s always DNS”.
More specifically, I needed to know about the following:
-
number of errors/timeouts
-
capability to query over TCP or UDP
-
capability to monitor multiple DNS servers at once
-
return codes received in the answer (i.e.
NOERROR,SERVFAIL,NXDOMAIN, you name it) -
results available in Prometheus/OpenTelemetry format (although it currently export
vmrangebuckets only at the moment, there’s an open issue for that)
hostlookuper
As I couldn’t find the right tool for the job, I decided to dust off an old internal (to PostFinance) monitoring tool, namely hostlookuper, refresh it a bit and open source it: https://github.com/postfinance/hostlookuper
It’s written in Go, capable of the above, and its configuration is rather minimalistic:
 $ hostlookuper -h
Usage of hostlookuper:
  -debug
        enable verbose logging
  -dns-servers string
        comma-separated list of DNS servers. if the protocol is omitted, udp is implied, and if the port is omitted, 53 is implied (default "udp://9.9.9.9:53,udp://8.8.8.8:53,udp://one.one.one.one:53")
  -hosts string
        comma-separated list of hosts against which to perform DNS lookups (default "google.ch,ch.ch")
  -interval duration
        interval between DNS checks. must be in Go time.ParseDuration format, e.g. 5s or 5m or 1h, etc (default 5s)
  -listen string
        address on which hostlookuper listens. e.g. 0.0.0.0:9090 (default ":9090")
  -timeout duration
        maximum timeout for a DNS query. must be in Go time.ParseDuration format, e.g. 5s or 5m or 1h, etc (default 5s)
The tool is supposed to run as a daemon, and will continuously query the DNS servers you asked it to monitor, thereby collecting metrics such as their response time and error rate (provided they make any error!)
It exports its metrics on :9090/metrics per default and an example set of metrics are available here.
Interpreting the metrics
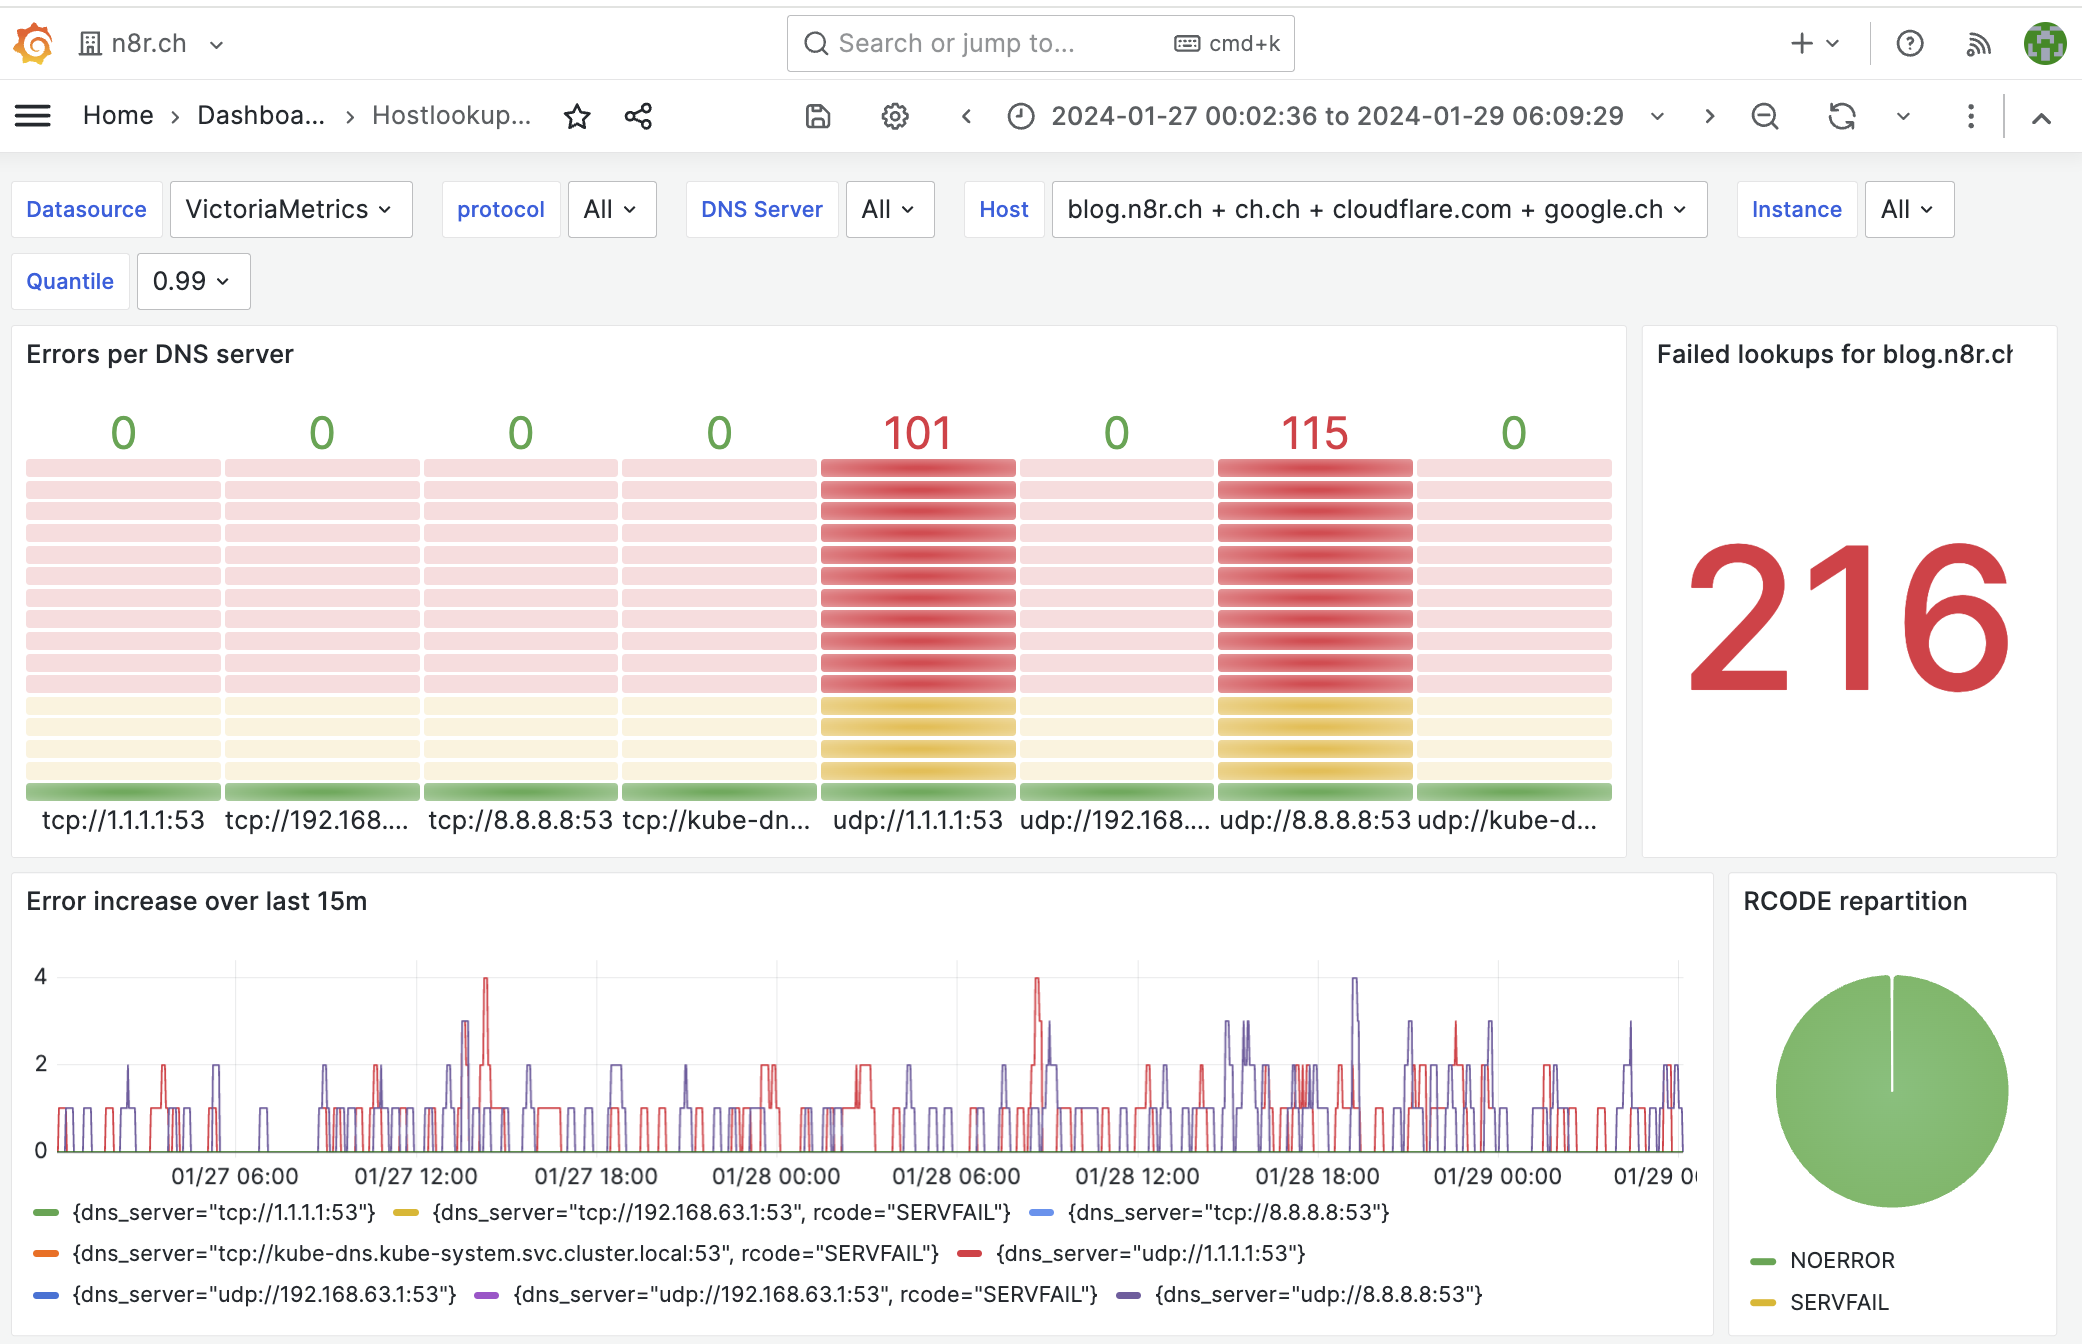
After letting it run for some time (see the example Kubernetes deployment), you’ll be able to import this Grafana dashboard to obtain a nice graphical overview of your DNS servers.
You get the return code (RCODE) repartition, the number of errors per DNS server, a heatmap of the duration of the request, and finally a per-server latency average.
How does it help?
When you configure hostlookuper to make both tcp and udp queries, it permits you to continuously know what the state of your network is: if one DNS server has issues, you’ll only see errors on that DNS server, but when multiple DNS servers see their error counter going up, you might as well have a network or I/O issue at hand.
Concretely, it has already helped us detect an internal DNS server with a problematic version, which was dropping 0.5% of requests. What would have been extremely complicated to pinpoint was rendered as easy as looking up a Grafana dashboard.
You can also configure hostlookuper to query both a load-balanced DNS server and its backend. It permits you to make sure that during maintenance of a backend the load-balanced server is performing correctly.
Finally, it’s quite interesting to see the correlation on the network traffic and number for udp queries dropped: as soon as you saturate your uplink, you will start to see DNS errors.
What next?
Some future steps include
- permit exporting metrics for non-VictoriaMetrics consumers (i.e. all Prometheus users to begin with) (issue #3)
- permit querying IPv6 DNS servers (issue #21)
- add some examples to let it run as a
systemdservice, for running it outside Kubernetes - Get it more traction/adoption, as it could probably help diagnose many infrastructure issues 🙂
If there’s a feature you need or a bug you encounter, please file a Github issue, I’ll be happy to work on it!