This article is a written companion to my KubeCon EU 2026 talk of the same name. It covers four stories from five years of running a Kubernetes platform at PostFinance, a systemic Swiss financial institution: SLOs as a reliability driver, open-source monitoring tools, continuous end-to-end testing, and an interactive debugging session tracking down rare 502 errors.
The interactive visualizations below (hash ring, race condition sequence diagram) are ported from the Slidev presentation so you can explore them at your own pace.
Context
PostFinance operates ~35 Kubernetes clusters in an air-gapped environment with strict regulatory requirements. The platform has been in production for 5+ years, initially built on kubeadm/Debian and now undergoing a migration to Talos managed via TOPF.
In banking, every failed request is a potential denied payment. This shapes how we approach reliability — even single-digit errors out of millions matter.
Part 1: SLOs as a Driver
From “it feels slow” to data-driven reliability
For months, developers complained that “the cluster feels slow today.” We had basic Grafana dashboards, but no clear targets. Without a number and a timeline, “slow” is subjective and easy to ignore.
Defining API Server SLOs
We defined three SLOs for the Kubernetes API server (following the SRE book approach):
- Availability — less than 0.1% of requests return 5xx or 429
- Latency (read) — GET/LIST within threshold (varies by subresource & scope)
- Latency (write) — POST/PUT/PATCH/DELETE within 1s
Writing the PromQL queries by hand would have been tedious, but sloth made it tractable:
slos:
  - name: apiserver-availability
    objective: 99.9
    sli:
      events:
        error_query: sum(apiserver_request_total{code=~"5..|429"})
        total_query: sum(apiserver_request_total)
From these definitions, sloth generates all recording rules, multi-window burn-rate alerts, and error budget calculations automatically.
SLOs Reveal the Truth
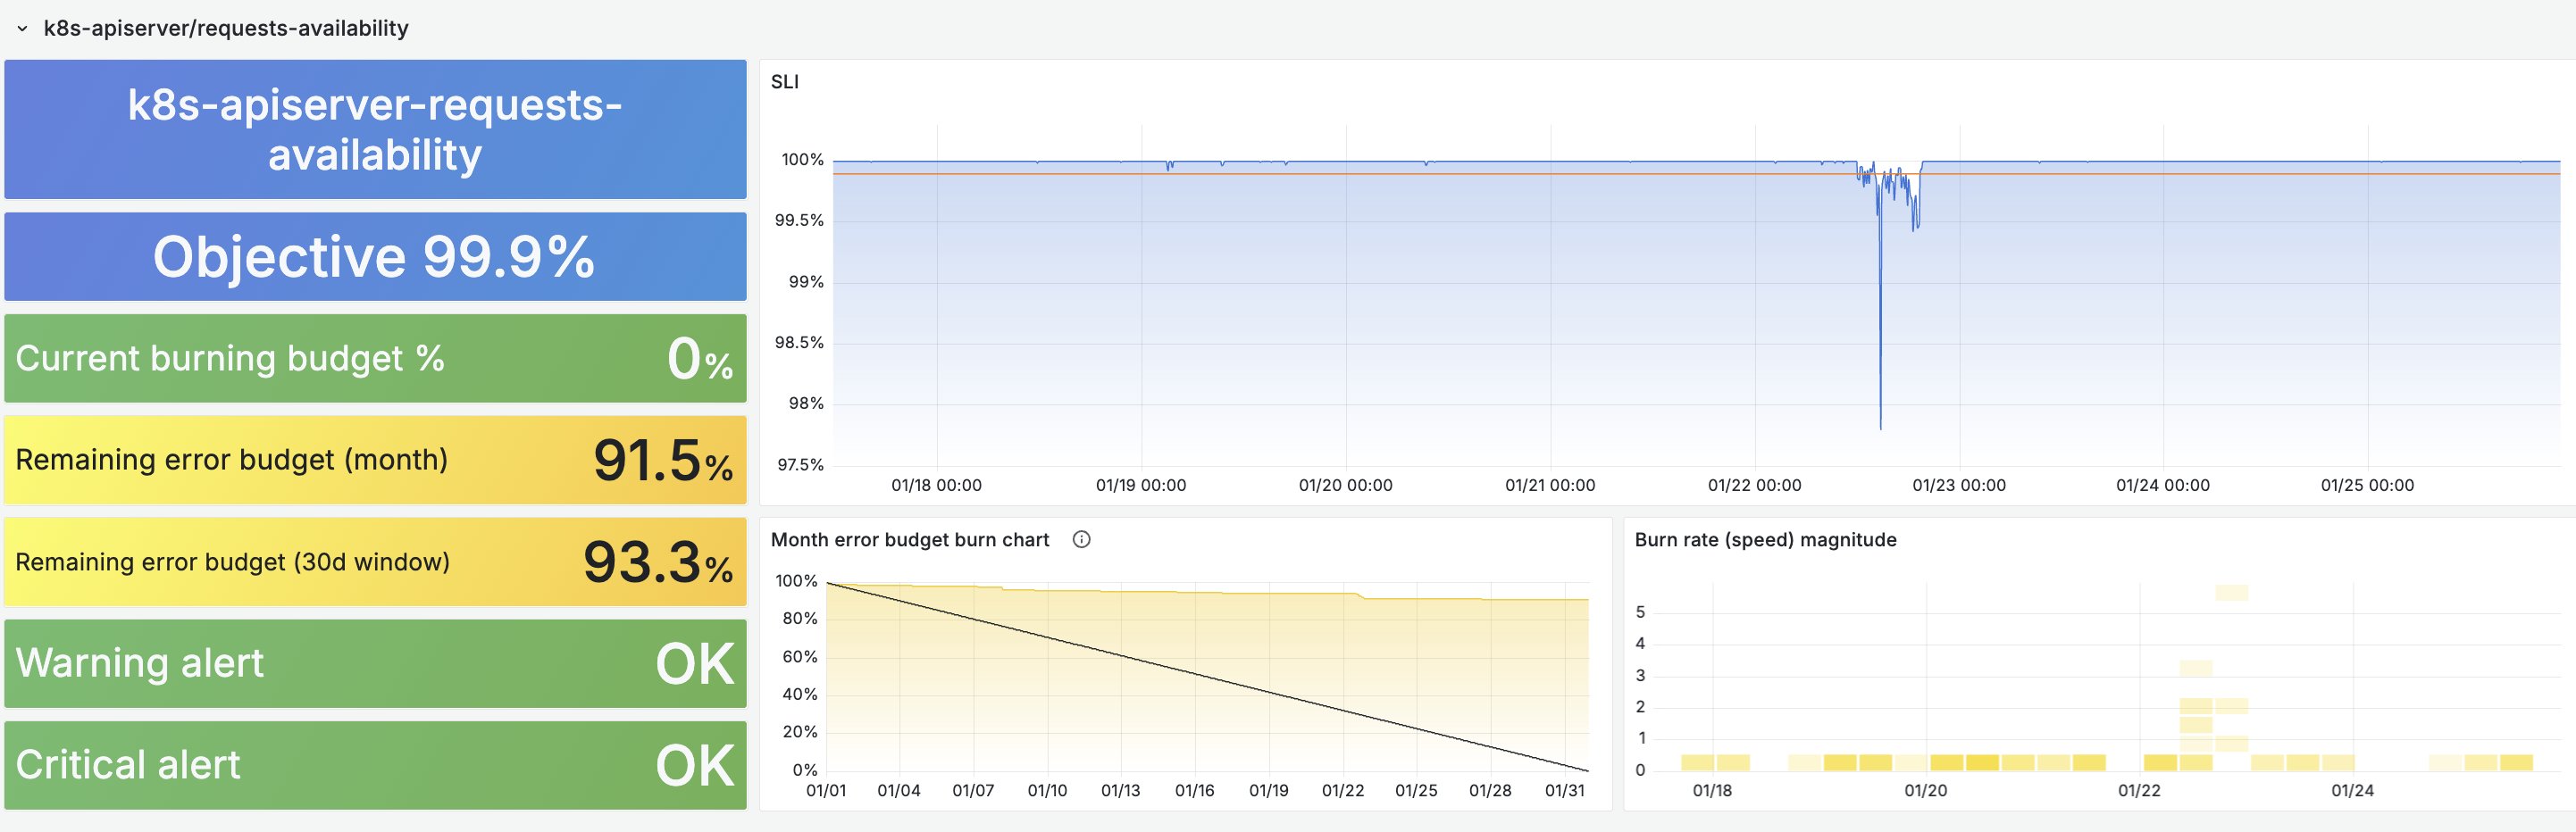
Once SLOs were live, “the cluster feels slow” became “we burned 40% of our error budget during Tuesday’s upgrade.” We were able to clearly correlate disruption with some of our actions and this motivated us to improve the situation.
Fix #1: etcd Topology
Our initial topology had each API server connecting to all 3 etcd members (a variant of the external etcd topology). When one etcd node was upgraded, all 3 API servers were impacted.
Loading diagram...

We switched to a stacked topology: each API server talks to its local etcd only. An etcd upgrade now impacts only one API server instead of all three. This improved the situation already, but we were still encountering degraded apiserver availability during cluster maintenance, so we had to look further.
Loading diagram...
Fix #2: etcd Leadership Migration
Before upgrading a node, we now migrate etcd leadership to another member:
etcdctl move-leader $NEW_LEADER_ID
This avoids leader elections during the maintenance window — a light improvement but not the full solution.

Fix #3: The Real Culprit — --goaway-chance
The biggest issue was that one control-plane node was doing all the work while the other two sat idle. Not only was the load poorly distributed, but more critically the two other apiserver instances never had to populate their caches. When the busy apiserver was shut down for maintenance, the remaining two would choke while their caches were being filled from scratch.
The root cause: long-lived HTTP/2 connections never redistributed. Clients open a TCP connection once and reuse it for all requests forever.
The fix: --goaway-chance=0.001 on the API server. 1 in 1000 requests gets a
GOAWAY frame,
causing the client to reconnect through the load balancer. Once all API servers
were handling traffic and had warm caches, upgrades stopped being a problem.
Part 2: Open-Source Monitoring Tools
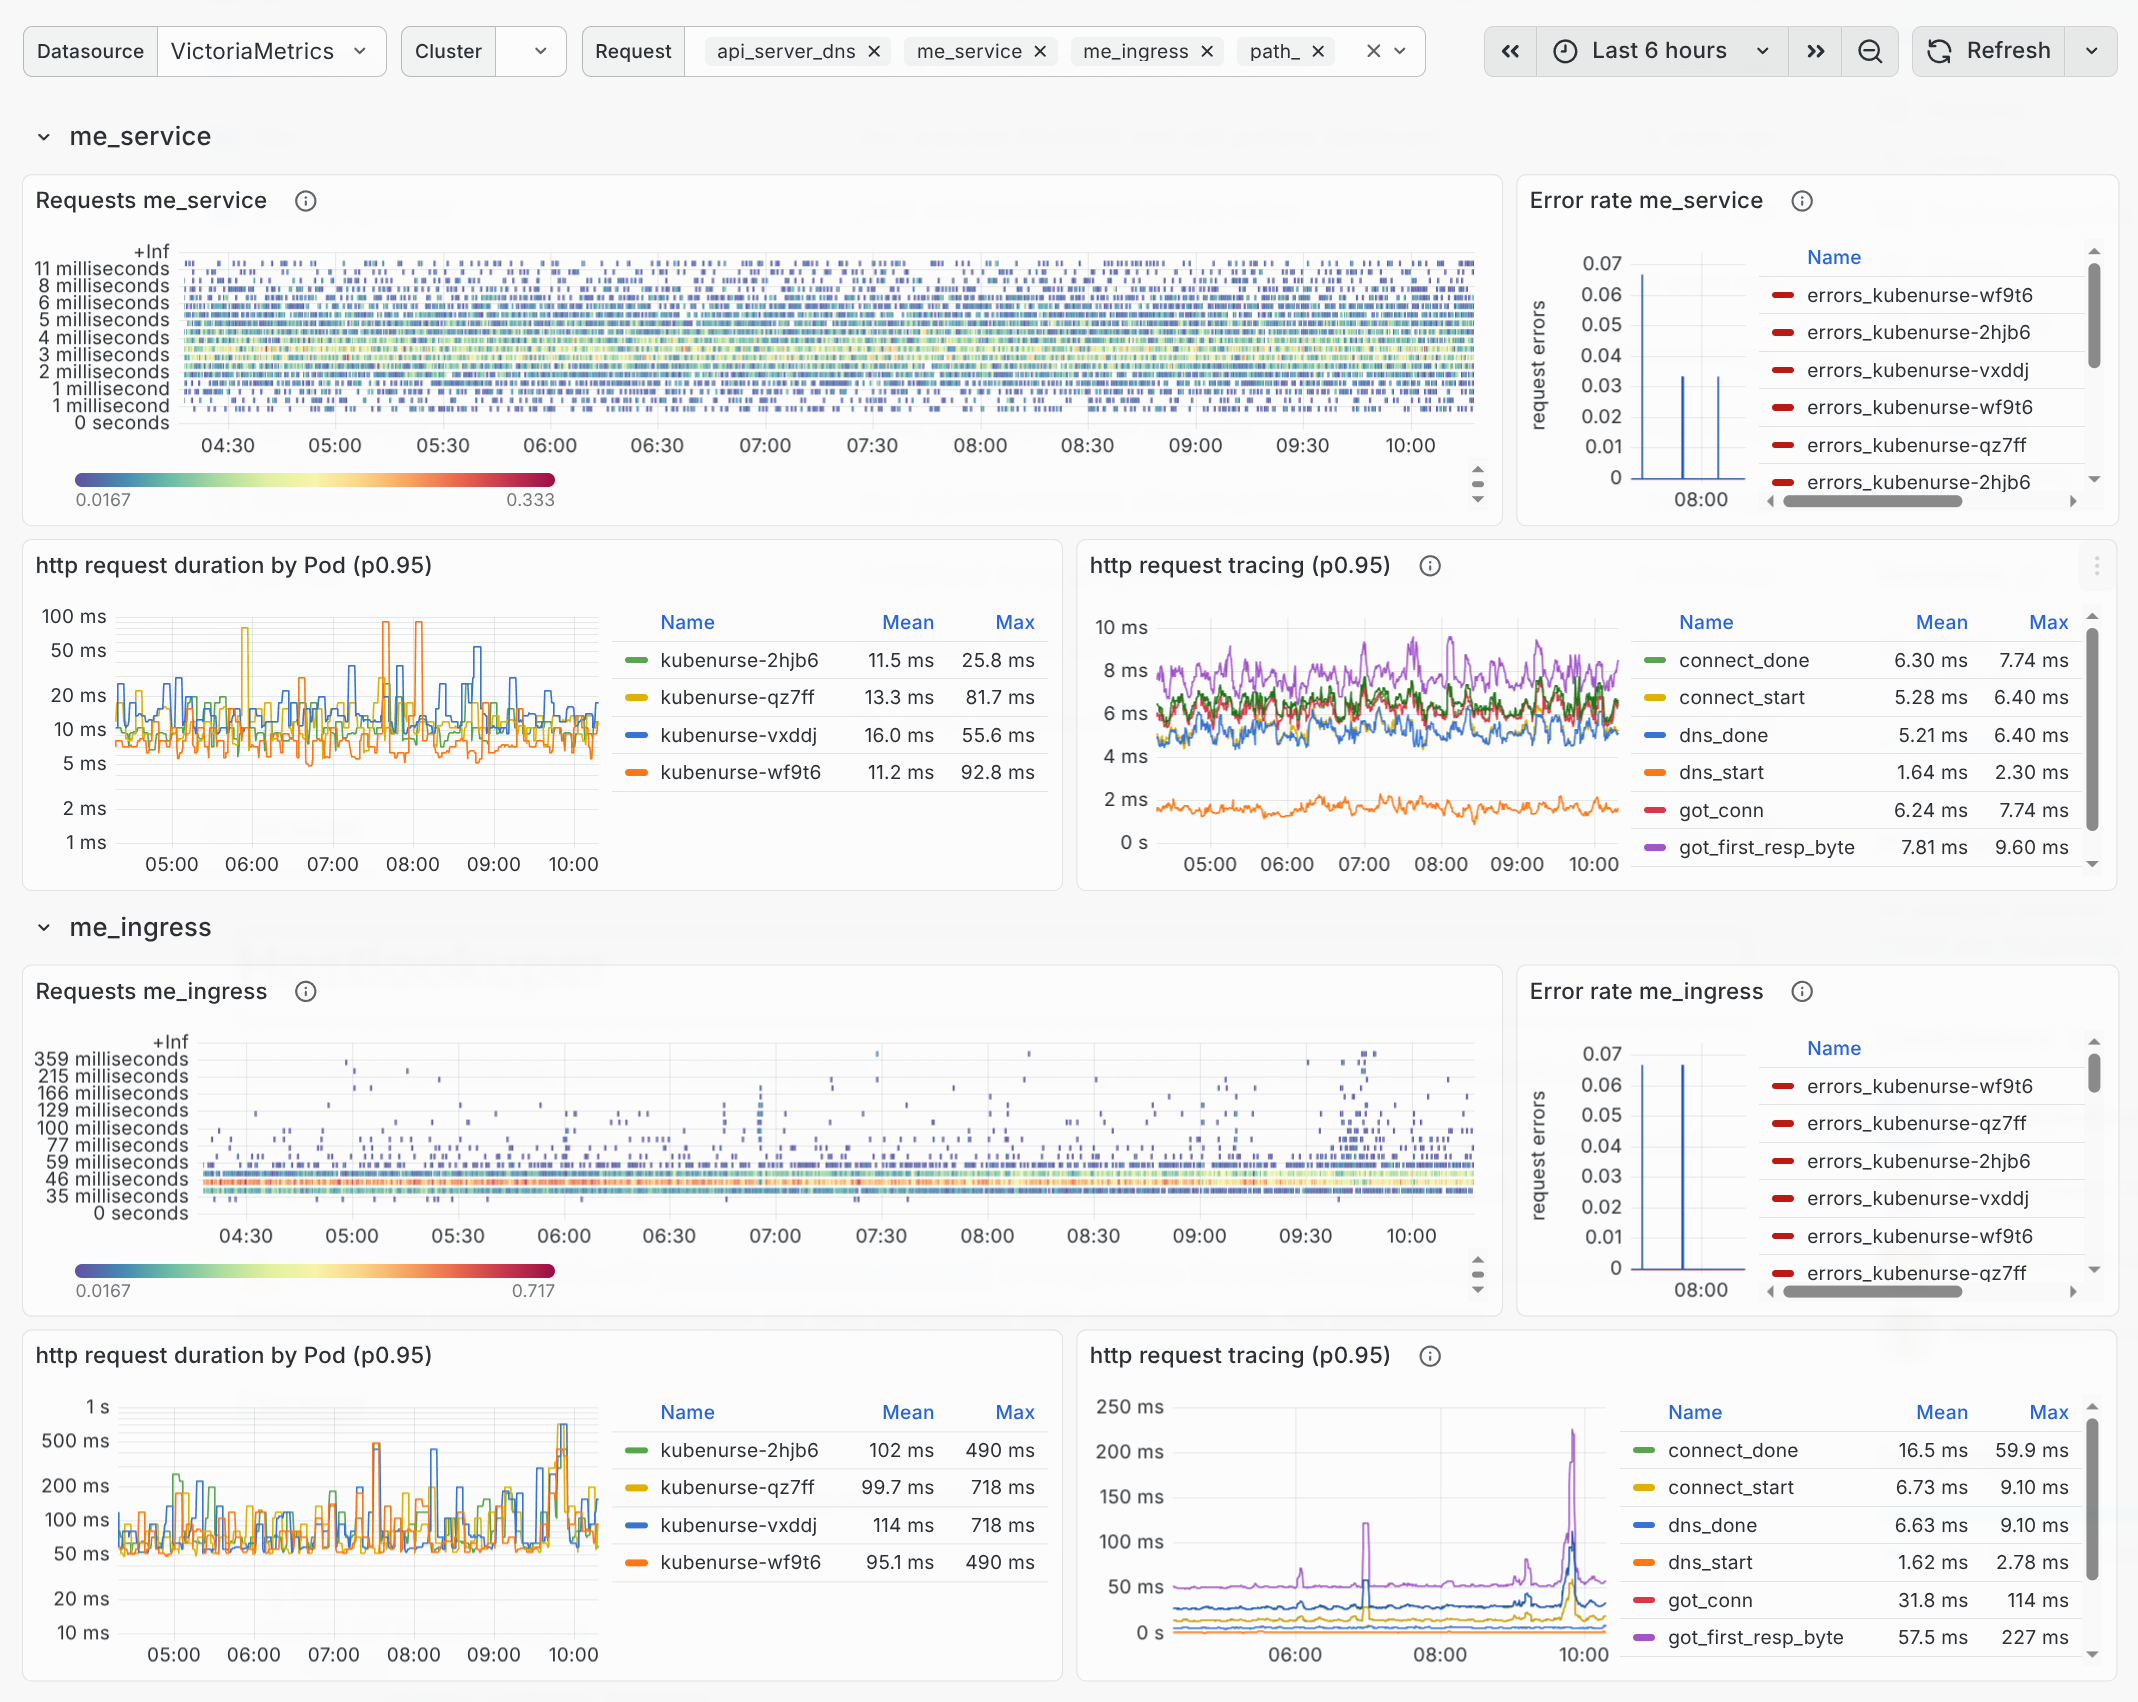
kubenurse
kubenurse is a DaemonSet that performs continuous network health checks across your cluster. Each pod validates 5 different network paths from every node (see also my detailed kubenurse article):
- API server (DNS) — through
kubernetes.default.svc.cluster.local - API server (IP) — direct endpoint, bypassing DNS
- me-ingress — through the ingress controller
- me-service — through the cluster service
- Neighbourhood — node-to-node checks
Loading diagram...
httptrace Instrumentation
Metrics are labeled with
httptrace event types, giving a precise
breakdown of each request phase: dns_start, connect_done,
tls_handshake_done, got_first_response_byte, etc. When something fails, you
know exactly which phase failed.
O(n²) → O(n): Deterministic Neighbor Selection
A community discussion identified that the original design had every pod checking every other pod — O(n²) total checks. The fix: node names are SHA-256 hashed and each pod checks only its n nearest neighbors in hash order (default: n=10).
The distribution is random but deterministic — stable metrics across restarts. Use the interactive visualization below to explore this:
hostlookuper
hostlookuper is simpler: it periodically resolves DNS targets and exports latency + error counters as Prometheus metrics. DNS is an excellent network congestion indicator — UDP packets are not retried and result in errors, making DNS failures often the first sign of trouble.
Graceful Shutdown: Lameduck Mode
SLOs on kubenurse itself revealed errors on the me_ingress check during node
upgrades. The problem isn’t specific to ingress-nginx: SIGTERM arrives, but
the load balancer doesn’t know yet, so requests still route to a dying process.
The fix (inspired by CoreDNS): lameduck shutdown
(commit).
On SIGTERM, keep serving for a few seconds (default: 5s), giving the LB/proxy/CNI
time to catch up and stop sending traffic. Then stop the server.
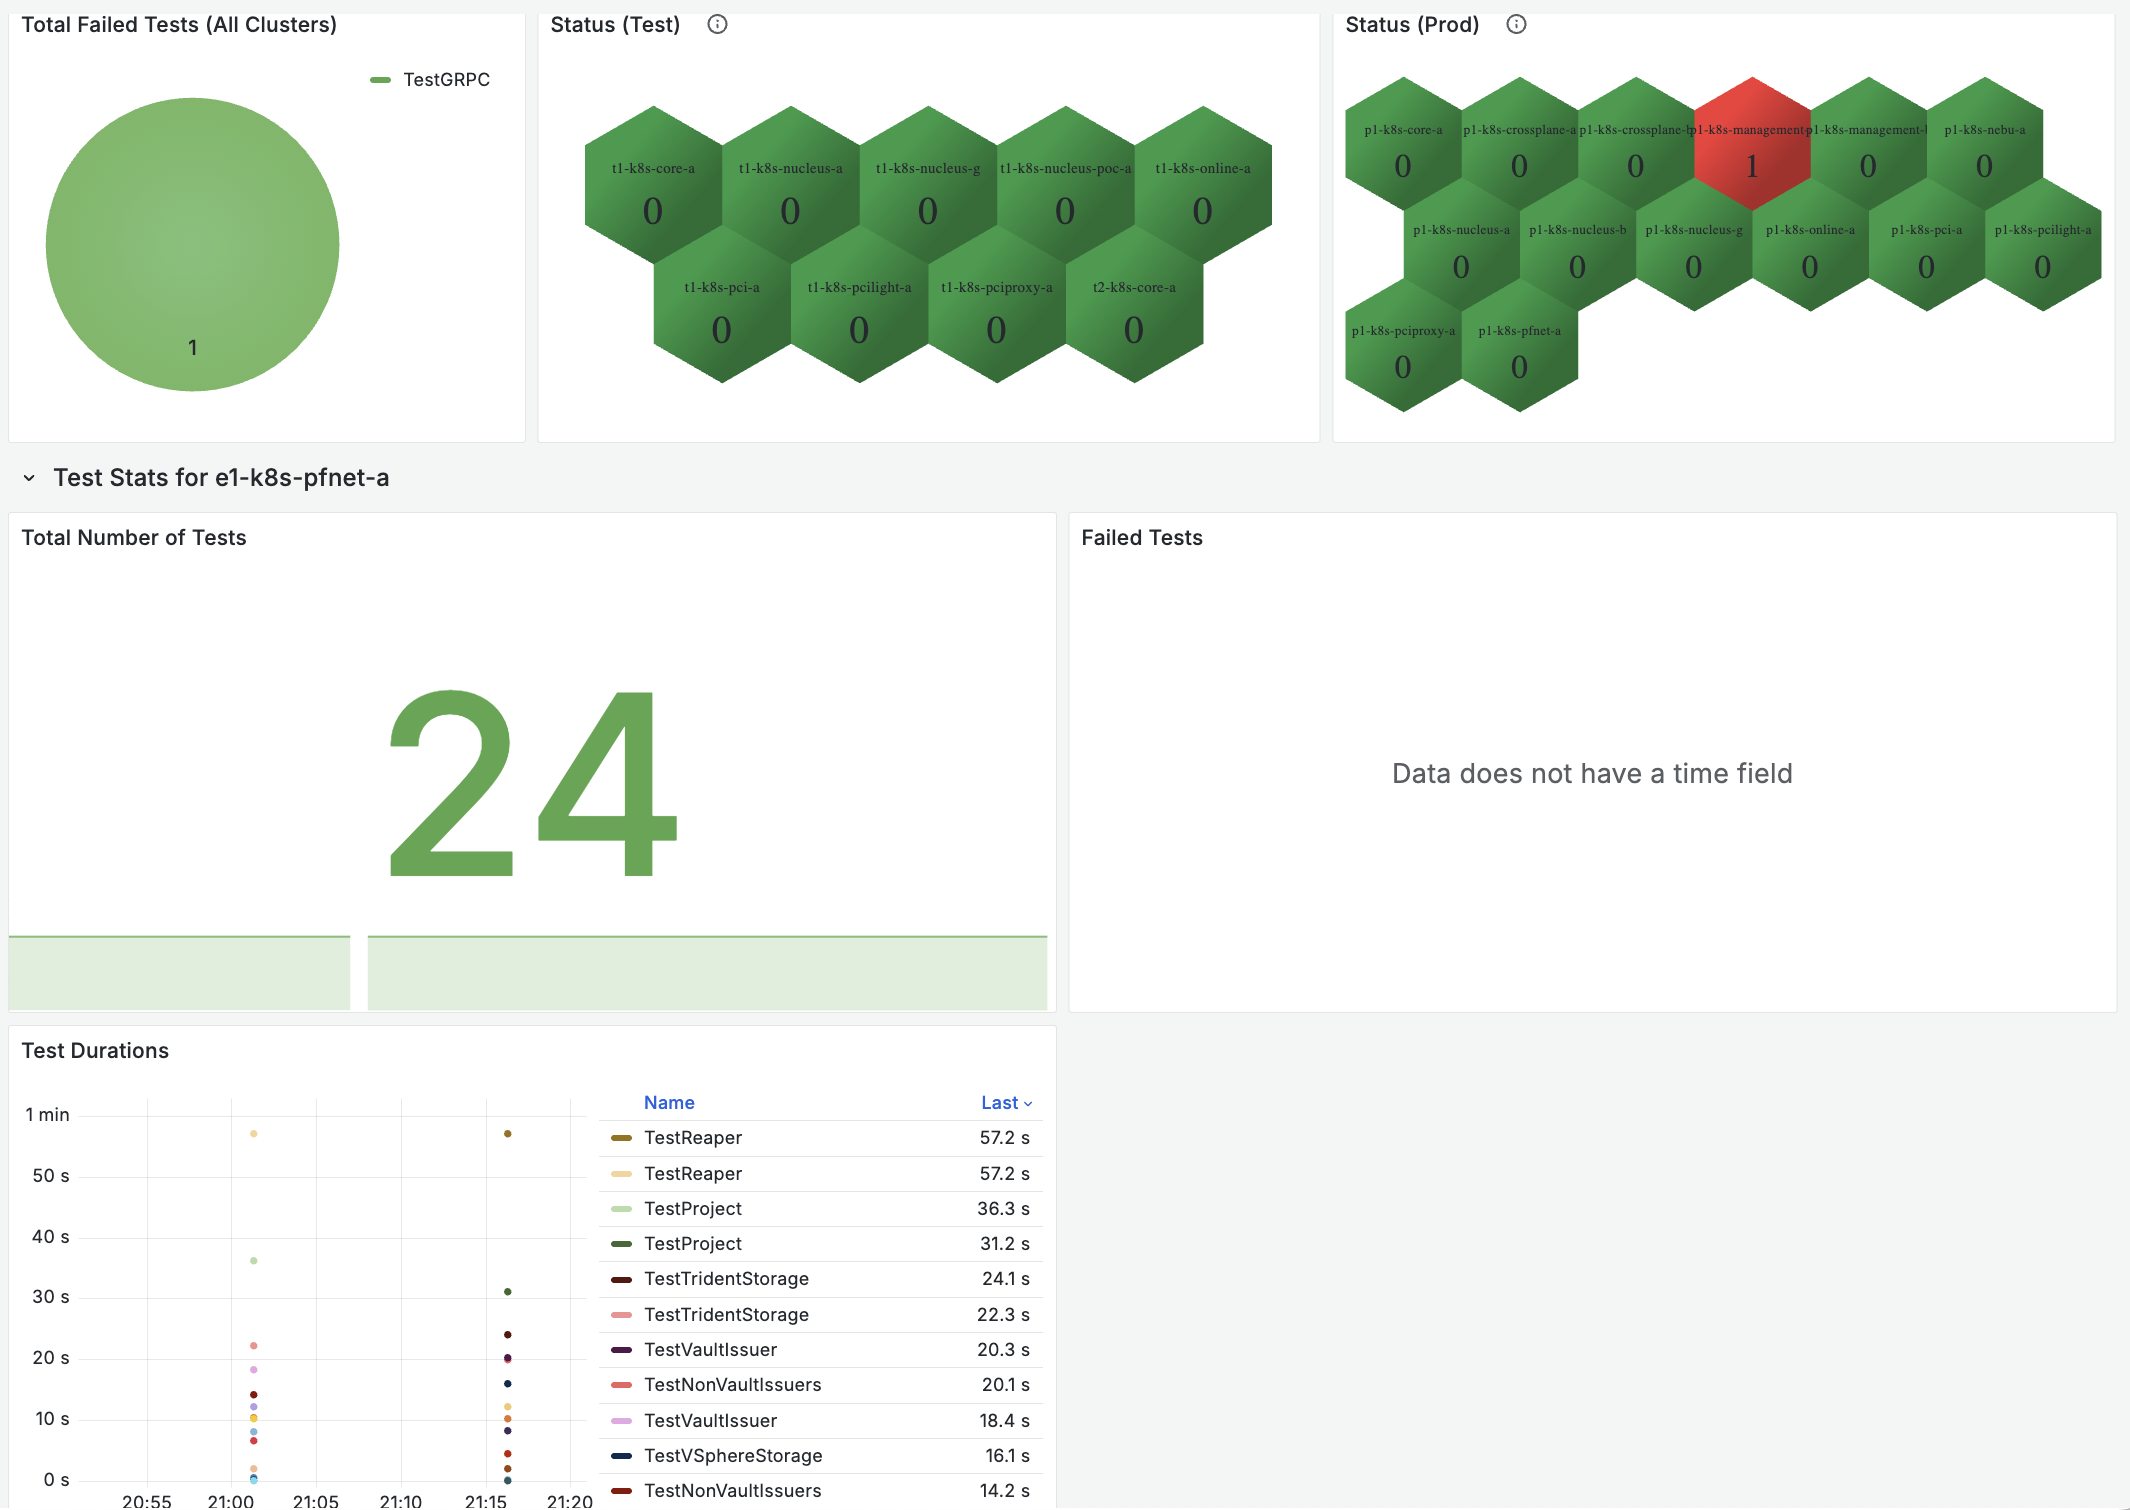
Part 3: Continuous End-to-End Testing
Your end users should NOT be your end-to-end tests
Complex interactions between Kubernetes components (networking, storage, security, DNS) can fail in subtle ways that unit tests and CI pipelines don’t catch.
Our Approach
A Go test suite using e2e-framework, scheduled as a Kubernetes CronJob running every 15 minutes. Results are captured with OpenTelemetry and visualized in Grafana dashboards.
func TestKubernetesDeployment(t *testing.T) {
    start := time.Now()
    t.Cleanup(func() {
        metricsCollector.RecordTestExecution(t, time.Since(start))
    })

    dep := newDeployment("nginx", 3)
    err := env.Create(ctx, dep)
    require.NoError(t, err)

    waitForPodsReady(t, dep, 30*time.Second)
}
Open-Source: e2e-tests
I’ve written an analogous open-source implementation at clementnuss/e2e-tests that you can fork and adapt. It covers:
| Test | What it validates |
|---|---|
| Deployment | Pod scheduling, container runtime, workload lifecycle |
| Storage (CSI) | PV provisioning, read/write operations |
| Networking | DNS resolution, service discovery, inter-pod connectivity |
| RBAC | Role-based access boundaries, permission enforcement |
Deploy as a CronJob, stream metrics to an OTLP endpoint, and you get instant cluster health monitoring with alert rules that trigger on test failures.
Part 4: The 502 Mystery
This section summarizes the investigation — for the full deep-dive, see my dedicated 502 article.
The Symptoms
A Tomcat-based e-finance application serving ~1.7M requests/day on one ingress. 8–10 failures per day — roughly 6 per million. Observations:
- 502s uniformly distributed across all ingress-nginx pods
- No pattern in time, endpoint, or client
- App pods healthy, no errors in application logs
- Load testing with K6 couldn’t reproduce it
- Errors correlate with request volume, but the rate stays constant
The Breakthrough
ingress-nginx error logs contain the FQDN, not the ingress name. We were searching for the wrong thing. Once we filtered by hostname, we found:
upstream prematurely closed connection while reading response header from upstream
This told us: nginx had an open keepalive connection, sent a request on it, but the backend closed the connection before responding → 502 Bad Gateway.
The Race Condition
Two conflicting keepalive timeouts:
- nginx: keeps connections open for 60s (default)
- Tomcat: closes idle connections after 20s (default)
The race window: the connection sits idle for ~20s, Tomcat sends a FIN to close it, and at nearly the same moment nginx sends a new request on that connection. The packets cross in flight → 502.
Explore the race condition with this interactive sequence diagram:
The Fix
One environment variable:
export TC_HTTP_KEEPALIVETIMEOUT="75000" # 75s > nginx's 60s
The rule: the upstream keepalive_timeout must be greater than the
reverse proxy’s. nginx defaults to 60s; Tomcat was at 20s, now set to 75s. The
backend always outlives the proxy’s connection → no more race.
Reproducing with K6
Standard load tests failed because they didn’t test idle + burst patterns. The key insight: cycle through load → idle → load phases with varying idle durations to hit the keepalive race window:
import http from 'k6/http';
import { check, sleep } from 'k6';

// Cycle: ramp up → sustain → ramp down → idle
// Idle duration increases (4s→11s) to maximize
// chance of hitting Tomcat's 20s timeout boundary
function generate_stages() {
    var stages = []
    for (let i = 4; i < 12; i++) {
        stages.push({ duration: "5s", target: 100 });
        stages.push({ duration: "55s", target: 100 });
        stages.push({ duration: "5s", target: 0 });
        stages.push({ duration: i + "s", target: 0 });
    }
    return stages
}

export let options = {
    noConnectionReuse: true,
    noVUConnectionReuse: true,
    scenarios: {
        http_502: {
            stages: generate_stages(),
            executor: 'ramping-vus',
            gracefulRampDown: '1s',
        },
    },
};

export default function() {
    let data = { data: 'Hello World' };
    for (let i = 0; i < 10; i++) {
        let res = http.post(
          `${__ENV.URL}`, JSON.stringify(data));
        check(res, {
          "status was 200": (r) => r.status === 200
        });
    }
    sleep(1);
}
Key Takeaways
- SLOs are a forcing function — from “it feels slow” to data-driven fixes (etcd topology, leadership migration, goaway-chance)
- Open-source your tools — the best fixes come from community discussions, not always code, sometimes just the right conversation (kubenurse #55)
- Test continuously, in-cluster — your end users should not be your e2e tests
- Every error matters — 8 out of 1.7M requests still deserved investigation
Links
- kubenurse — network monitoring DaemonSet
- hostlookuper — DNS monitoring
- TOPF — Talos fleet management
- e2e-tests — K8s cluster validation CronJob
- sloth — SLO-to-recording-rules generator
- 502 upstream errors — full article
- kubenurse — detailed article