Alongside my work as a System Engineer (with a focus on Kubernetes) at
PostFinance, I’m married to a farmer in Switzerland, and live with her and her
family on the family farm.
This is quite different from my daily work, and I sometimes have the
opportunity to help by, for example, feeding calves during milking, using my
skills to install surveillance cameras, deploying a long-distance WiFi network
across the farm, or modernizing the milking monitoring.
It’s this latter point that I’m detailing today (without all the technical
details, which are covered in the
README of the
open-source project I’ve created for this purpose).
The milking on the farm
My wife and her family milk 65 Holstein dairy cows daily, at 5:30 in the morning and at 4:30 in the evening for the evening milking. Milking data is recorded in a software called Alpro, which hasn’t been updated since 2009.
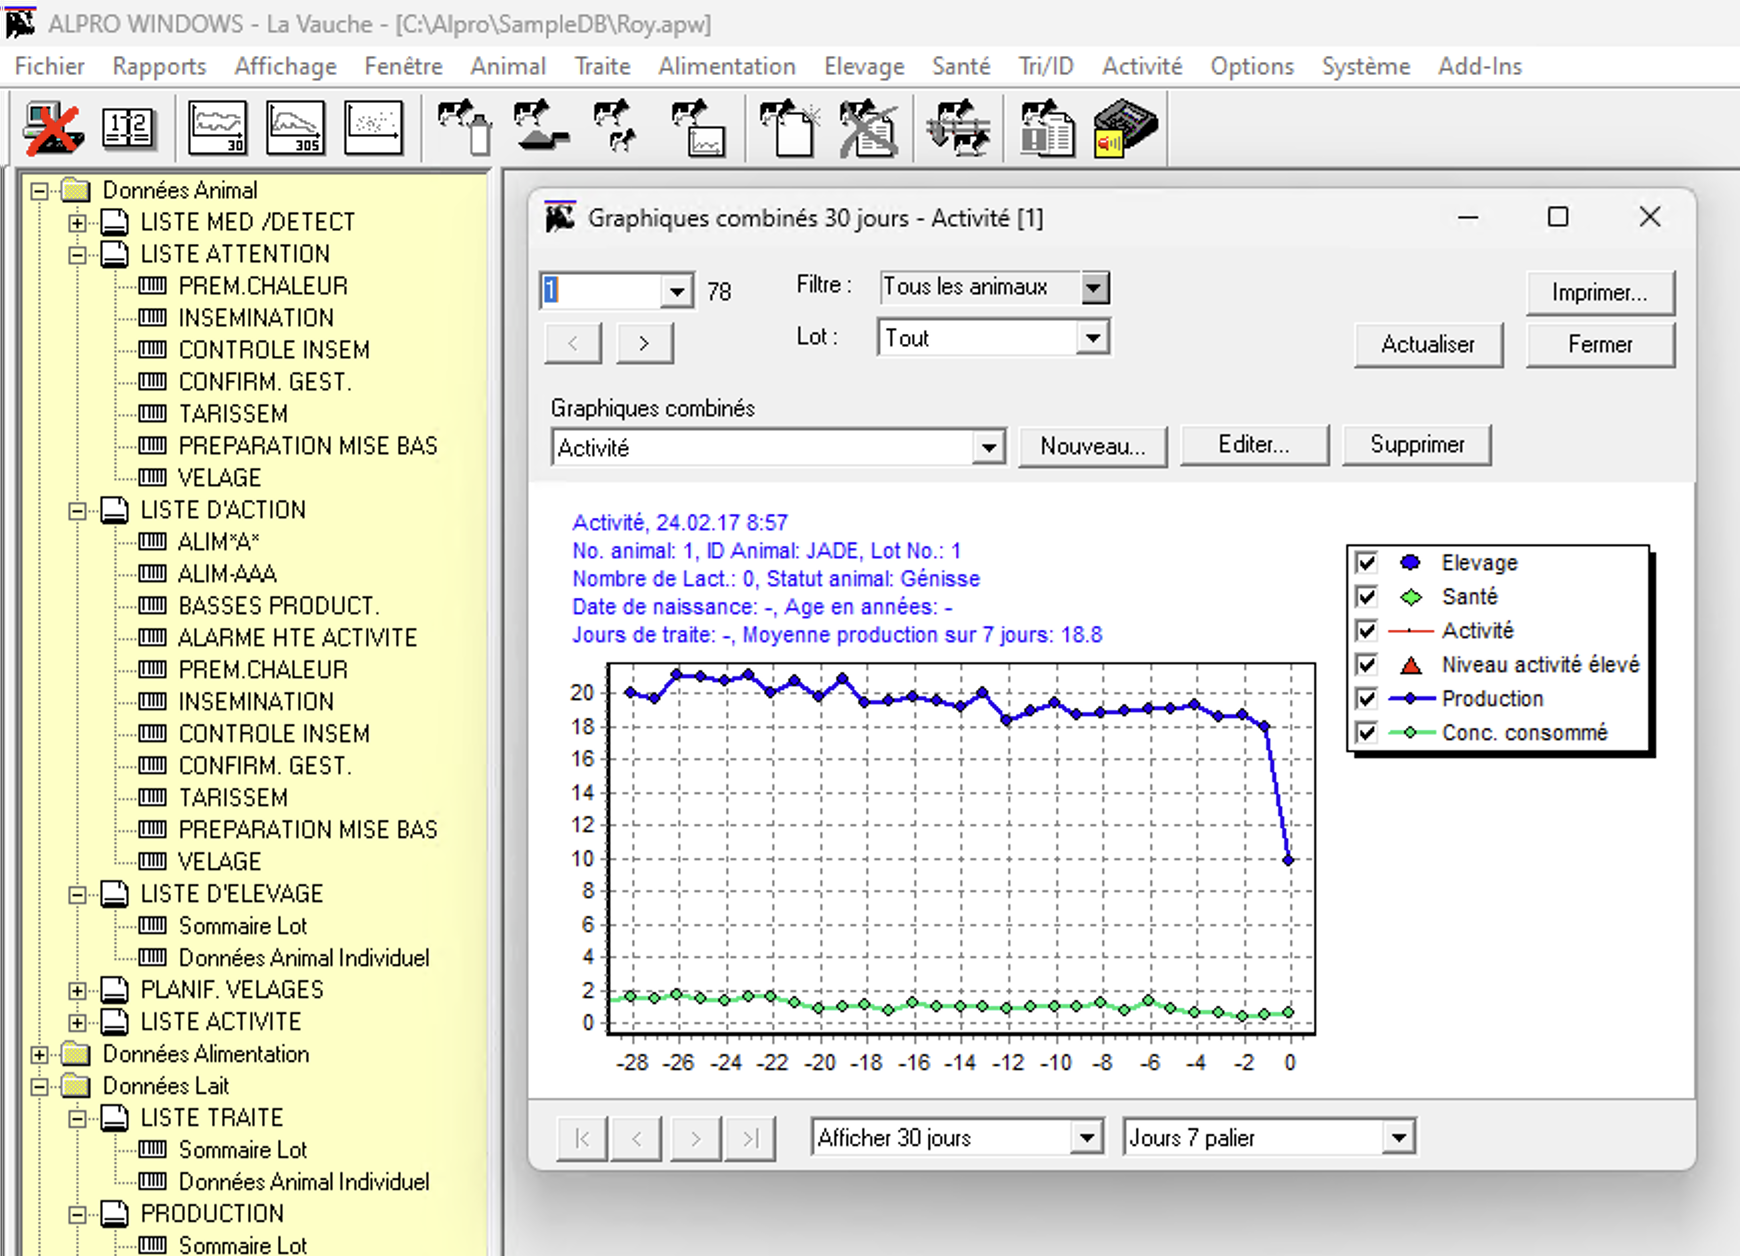
The software provides a lot of information about the cows, such as the quantity of milk for each milking, the amount of concentrate distributed to the cow, the duration of the milking, the number of days since the last calving, etc.
Although this data is interesting, accessing it requires connecting to the computer and using the old software with its outdated interface. Therefore, I became interested in trying to import milking data into a time-series database, so that I could later visualize this data with modern software that I use and appreciate daily: Grafana.
Importing Access Data
To do this, I looked into the database used by the Alpro software, which is a fairly old Access database but can still be opened with software such as MDB/ACCDB viewer on MacOS, Microsoft Access, or with the excellent open-source software mdbtools.
The process for extracting Access data and converting it to OpenMetrics/Prometheus format is as follows:
- I backup the Alpro database files using the open-source software restic, which allows me to easily make incremental backups every 15 minutes to an S3 server (in this case, Cloudflare R2, with a generous free tier), and which automatically manages backup rotation.
- Within a Kubernetes CronJob, I download the latest backup and convert the
access
.mdbfiles into anSQLitedatabase. - a python3
script
opens the
SQLitedatabase with the pandas library, parses the timestamps, filters erroneous/missing data, and finally produces OpenMetrics records which look like follows:
11                             cow_milk_yield{cow_id="JADE",cow_no="1",session="1",} 9.32 1705383960000
12                            cow_milk_yield{cow_id="JADE",cow_no="1",session="2",} 11.07 1705422540000
13                         cow_milk_yield{cow_id="JURAFLO",cow_no="2",session="1",} 16.63 1705384860000
14                         cow_milk_yield{cow_id="JURAFLO",cow_no="2",session="2",} 12.82 1705421520000
15                        cow_milk_yield{cow_id="JOLIMOME",cow_no="3",session="1",} 12.34 1705380300000
                                                     ...
4049                 cow_milk_daily_yield{cow_id="JETSET",cow_no="72",session="2",} 20.58 1708014720000
4051                 cow_milk_daily_yield{cow_id="FIGGIE",cow_no="75",session="2",} 20.87 1708015740000
4053                  cow_milk_daily_yield{cow_id="ETIVA",cow_no="77",session="2",} 24.34 1708014180000
4055    cow_milk_daily_yield{cow_id="JESSIE",cow_no="78",session="2",} 22.729999999999997 1708016460000
4057               cow_milk_daily_yield{cow_id="HESQUISE",cow_no="80",session="2",} 33.47 1708011780000
Name: 0, Length: 20290, dtype: objec
- I upload those records to my preferred time-series database: VictoriaMetrics
Data Visualization
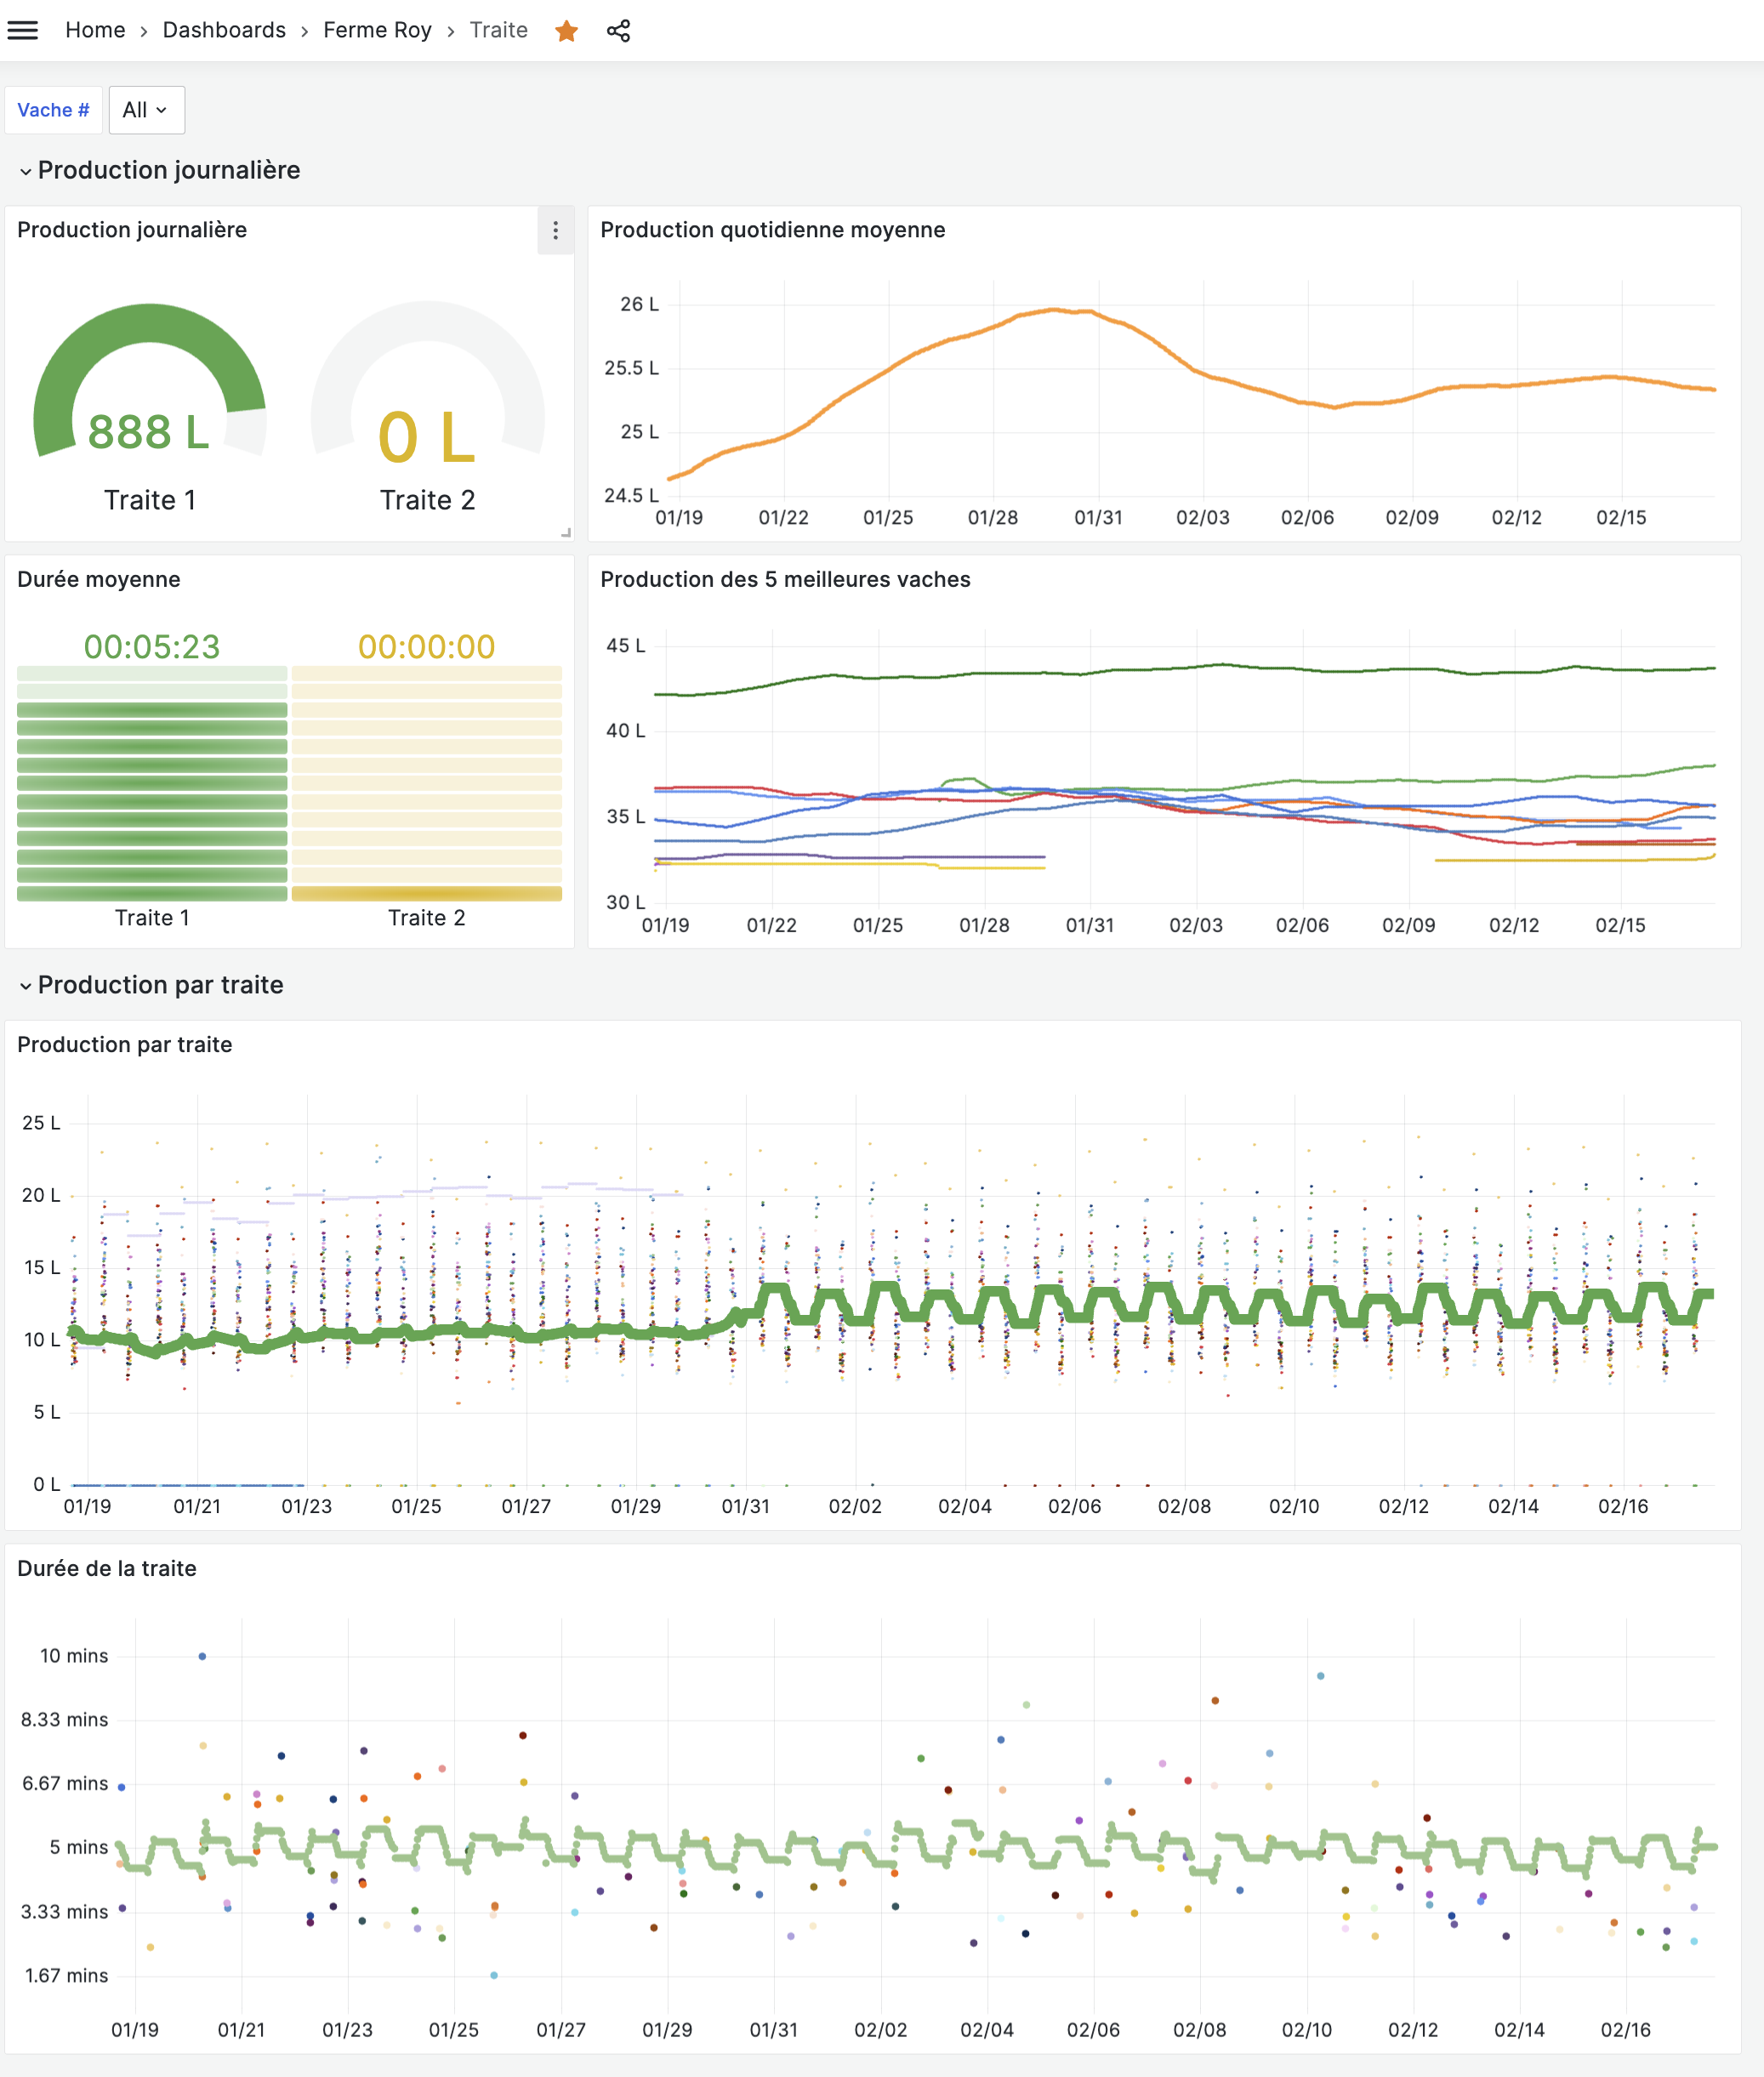
Since the milking data is available in VictoriaMetrics, I can use Grafana to visualize it. I could potentially create alerts in the future, for example, when it takes significantly longer to milk a cow than the previous day, or if the average milk production over 3 days drops significantly.
As Grafana is a web-based graph visualization solution, it’s now possible at any time to check the production of each cow, production trends, average milking duration, etc. And this can even be done from a mobile phone!
I’ll conclude this article with an overview of the visualization. The next episode will focus on farm’s methanization plant!