TL;DR: I added support for PrometheusHistograms (those with le buckets) to
the VictoriaMetrics/metrics
package (a lightweight alternative to
prometheus/client_golang), which
allows me to:
- Switch to the more lightweight
VictoriaMetrics/metricslibrary in my open-source projects, which I find simpler to use - Make it possible to choose between classical Prometheus histograms or VictoriaMetrics histograms (much more precise) with a flag
- Maintain compatibility with existing Prometheus-based monitoring setups
Problem
While working on kubenurse, I
wanted to switch from the heavier
prometheus/client_golang library
to the more lightweight
VictoriaMetrics/metrics package.
However, there was one significant blocker: the VictoriaMetrics library only
supported their own log-based histogram format, not the traditional Prometheus
histograms with static le buckets.
VictoriaMetrics histograms are indeed more precise and efficient, but sometimes
you need compatibility with existing Prometheus-based monitoring setups that
expect the traditional bucket format. Many organizations have dashboards,
alerts, and queries built around the classic Prometheus histogram format with
_bucket{le="..."} metrics.
This incompatibility meant I couldn’t easily migrate from
prometheus/client_golang without breaking existing monitoring infrastructure
for kubenurse adopters, which I was not willing to do.
Implementation
The implementation involved creating a new PrometheusHistogram type that:
- Uses static buckets with
lelabels - Compatible with standard Prometheus histogram format - Supports custom bucket definitions - You can define your own bucket boundaries
- Includes helper functions -
LinearBuckets()andExponentialBuckets()for common bucket patterns - Maintains the same API style - Consistent with the existing VictoriaMetrics/metrics patterns
Example Usage
Here’s how you can use the new PrometheusHistogram functionality:
package main

import (
    "github.com/VictoriaMetrics/metrics"
)

func main() {
    // Create a histogram with custom buckets for HTTP request duration
    requestDuration := metrics.NewPrometheusHistogram("http_request_duration_seconds", []float64{
        0.001, 0.005, 0.01, 0.025, 0.05, 0.1, 0.25, 0.5, 1, 2.5, 5, 10,
    })

    // Or use helper functions for common patterns
    responseSize := metrics.NewPrometheusHistogram("http_response_size_bytes",
        metrics.ExponentialBuckets(100, 2, 10)) // 100, 200, 400, 800, ...

    // Linear buckets for latency measurements
    latencyHist := metrics.NewPrometheusHistogram("api_latency_seconds",
        metrics.LinearBuckets(0.01, 0.01, 20)) // 0.01, 0.02, 0.03, ..., 0.20

    // Record observations
    requestDuration.Observe(0.042)  // 42ms request
    responseSize.Observe(1024)      // 1KB response
    latencyHist.Observe(0.165)   // 165ms latency
}
The metrics are then exposed in standard Prometheus format:
# HELP http_request_duration_seconds
# TYPE http_request_duration_seconds histogram
http_request_duration_seconds_bucket{le="0.001"} 0
http_request_duration_seconds_bucket{le="0.005"} 0
http_request_duration_seconds_bucket{le="0.01"} 0
http_request_duration_seconds_bucket{le="0.025"} 0
http_request_duration_seconds_bucket{le="0.05"} 1
http_request_duration_seconds_bucket{le="0.1"} 1
http_request_duration_seconds_bucket{le="0.25"} 1
http_request_duration_seconds_bucket{le="0.5"} 1
http_request_duration_seconds_bucket{le="1"} 1
http_request_duration_seconds_bucket{le="2.5"} 2
http_request_duration_seconds_bucket{le="5"} 2
http_request_duration_seconds_bucket{le="10"} 2
http_request_duration_seconds_bucket{le="+Inf"} 2
http_request_duration_seconds_sum 1.272
http_request_duration_seconds_count 2
Real-World Usage in kubenurse
I immediately put this to use in
kubenurse, switching from
prometheus/client_golang to VictoriaMetrics/metrics, which finally
permitted me to use the more precise log-based VictoriaMetrics histograms (more
details in Aliaksandr Valialkin’s blog article).
In addition to the much more detailed heatmaps, we now also have accurate P99 across our tracing, meaning we know precisely how long a DNS request takes, how much time we need to reach the load balancer, to reach a neighboring node, etc.
The following screenshots show the before and after comparison:
Before (Prometheus buckets):
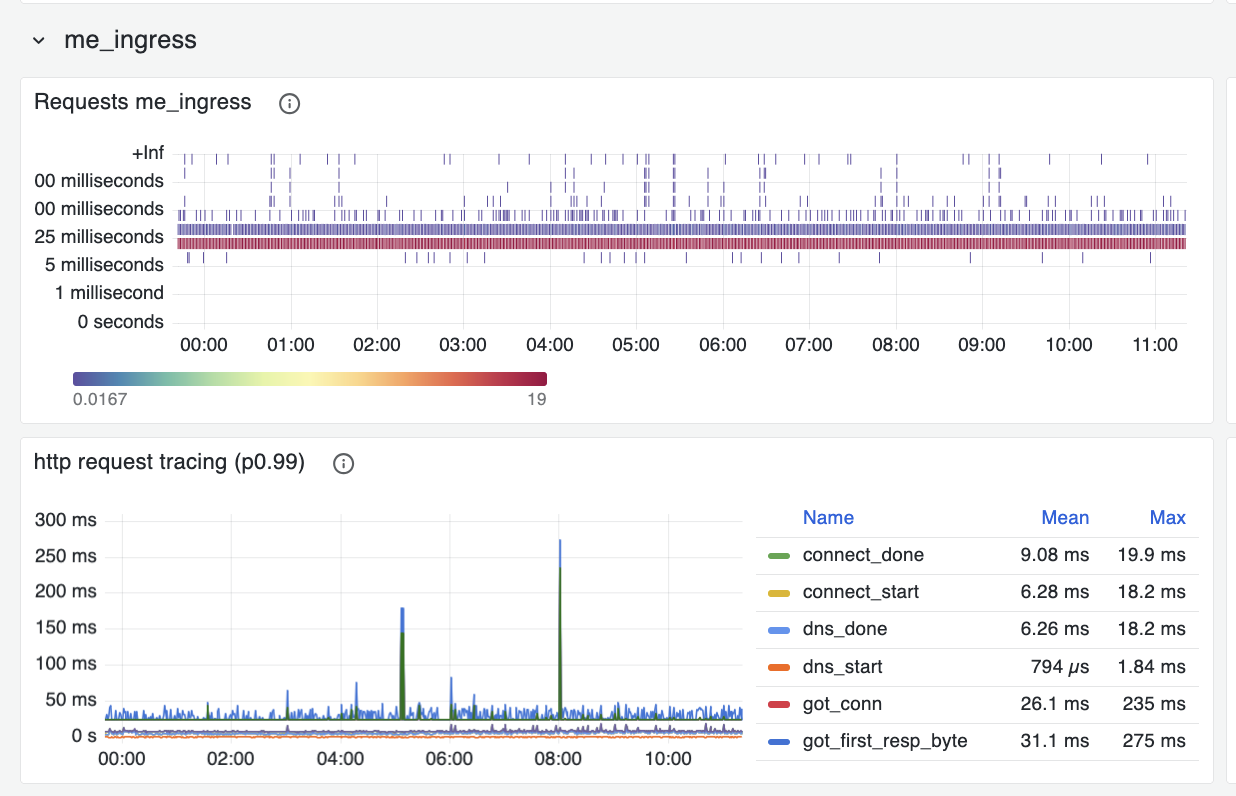
After (VictoriaMetrics buckets):
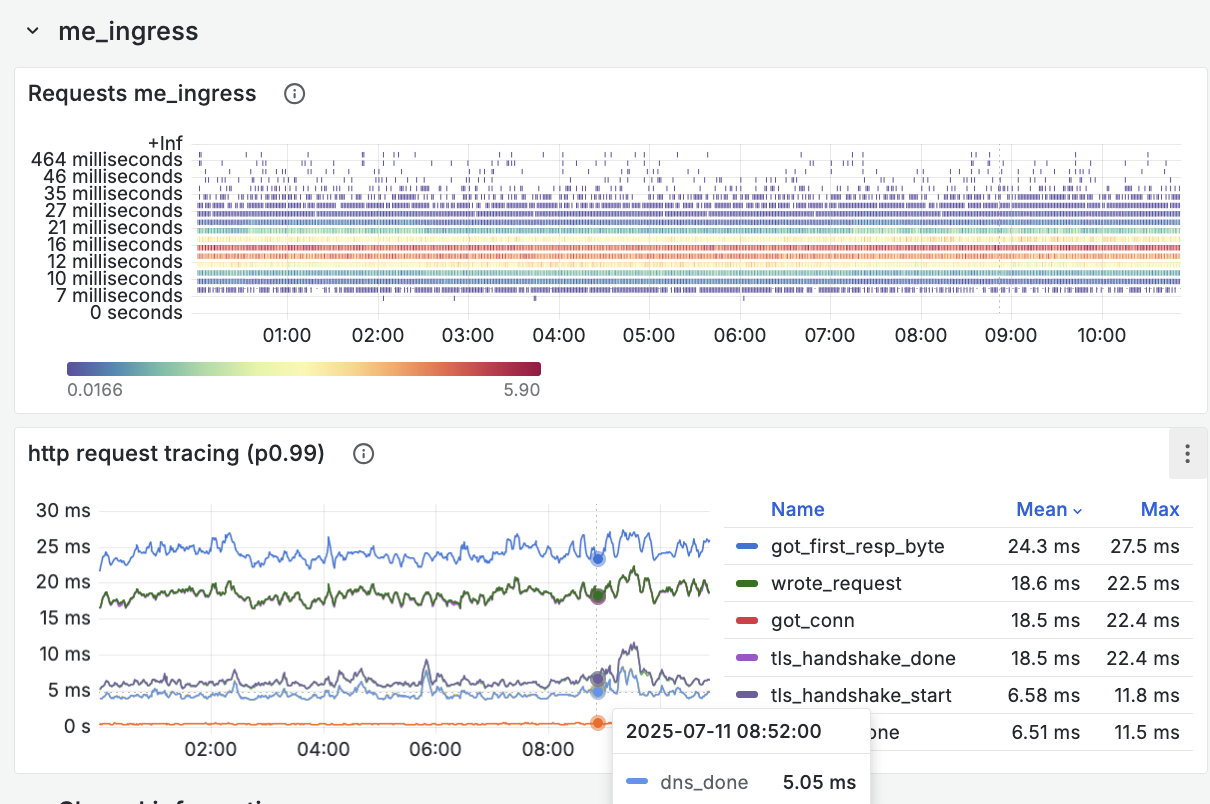
Whereas before hand most measurements were falling in the same le bucket, we
now have 18 log-based buckets for each power of 10 interval (i.e. 18 from 1 to
10, 18 from 10 to 100, etc.), which makes for a detailed heatmap and also for
accurate P99 measurements. We now know precisely how much time is spent on
every part of a request (DNS request, TCP connection establishment, TLS
handshake, etc.), which is really valuable.
Code Comparison
Not only does this PR offer more precision for people using VictoriaMetrics histograms, it also enables anyone willing to expose Prometheus metrics to use the simpler-to-use VictoriaMetrics library. Judge for yourself with the following two examples.
Before (with prometheus/client_golang):
import (
    "github.com/prometheus/client_golang/prometheus"
    "github.com/prometheus/client_golang/prometheus/promauto"
)

var (
    requestDuration = promauto.NewHistogramVec(
        prometheus.HistogramOpts{
            Name: "http_request_duration_seconds",
            Help: "HTTP request duration",
            Buckets: []float64{0.001, 0.005, 0.01, 0.025, 0.05, 0.1, 0.25, 0.5, 1, 2.5, 5, 10},
        },
        []string{},
    )
)

func recordRequest(method, status string, duration float64) {
    requestDuration.Observe(duration)
}
After (with VictoriaMetrics/metrics):
import "github.com/VictoriaMetrics/metrics"

var requestDuration = metrics.NewPrometheusHistogram("http_request_duration_seconds",
    []float64{0.001, 0.005, 0.01, 0.025, 0.05, 0.1, 0.25, 0.5, 1, 2.5, 5, 10})

func recordRequest(duration float64) {
    requestDuration.Observe(duration)
}
Conclusion
This contribution demonstrates how open-source collaboration can solve real-world problems. By adding Prometheus-compatible histograms to VictoriaMetrics/metrics, we’ve made it easier for teams to:
- Migrate gradually from prometheus/client_golang to VictoriaMetrics/metrics
- Maintain compatibility with existing Prometheus-based monitoring infrastructure
- Choose the right tool for their specific histogram needs without vendor lock-in
- Reduce resource usage while maintaining observability standards
The full PR with code changes is available at: https://github.com/VictoriaMetrics/metrics/pull/93
For more details on kubenurse and how it uses these metrics, check out my previous article on kubenurse.